The Mathematics of Cardboard Gold: A Comprehensive Model for Sports Card Valuation and Investment
Introduction In an era where cardboard rectangles can outpace stocks, crypto, and gold, the sports trading card market has evolved from a…
Introduction
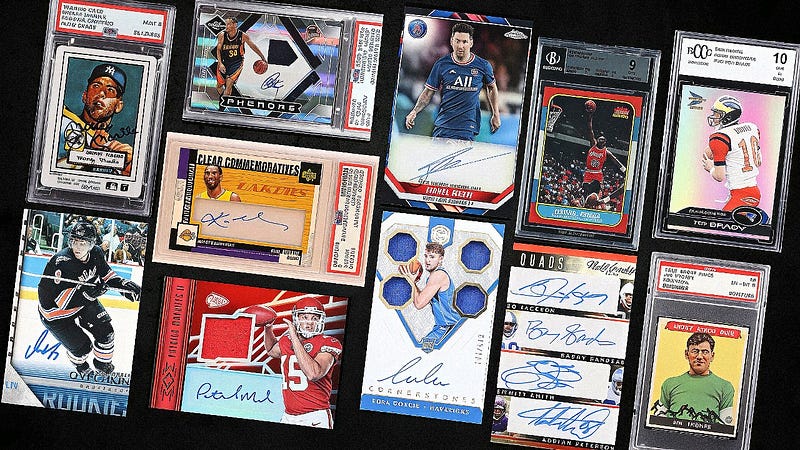
In an era where cardboard rectangles can outpace stocks, crypto, and gold, the sports trading card market has evolved from a childhood hobby into a high-stakes investment landscape. But as values skyrocket and crash with dizzying volatility, how can collectors and investors make rational, data-driven decisions? The answer lies in building a comprehensive, flexible model that accounts for the key variables influencing card value — grading, market sentiment, selling costs, and ROI. This guide lays out such a model, enabling sharper decisions and smarter exits for those navigating this modern collectibles economy.
Grading: The First Multiplier
Professional grading isn’t just authentication — it’s value transformation. A raw card becomes a financial instrument once it’s encapsulated in a PSA, BGS, or SGC slab. PSA remains the industry standard, often yielding the highest multipliers. A Gem Mint 10 from PSA can be worth three to five times the value of its raw counterpart. BGS, with its subgrades and coveted Black Label 10, can sometimes eclipse PSA for pristine modern cards. SGC, while trailing slightly in resale value, has carved a niche in vintage and fast-turnaround services.
A practical model assigns grading multipliers — say, 3.0× for PSA 10, 2.5× for BGS 9.5, and 2.3× for SGC 10 — while recognizing these values shift over time and across card eras. This grading tier acts as the bedrock for projecting sale value.
Raw vs. Graded Price Trends: Quantifying the Jump
Grading pays — when you hit. A 2018 Ronald Acuña Jr. rookie might fetch $100 raw, but over $1,000 graded PSA 10. That’s a 900% increase. Yet the value hike is conditional. For modern cards, PSA 9 may hover just above raw value. For vintage icons, however, the graded premium can be exponential: a raw Michael Jordan rookie might be $6,000; in PSA 10, it’s over $200,000.
A simple equation to assess the jump:
Graded Value = Raw Value × Grading Multiplier
It’s the collector’s version of compound interest. But beware: the upside only materializes if the card scores high. Mid-grade outcomes often erode profitability.
Market Dynamics: Player Hype, Scarcity, and Sentiment
Even a PSA 10 won’t save a card if no one wants it. Market valuation pivots on performance, scarcity, and sentiment. A breakout game or MVP season can add 10–30% overnight. Conversely, a torn ACL or trade to a small market tanks demand. Scarcity — both in print runs and in population reports — can drastically affect price. A PSA 10 pop of 10 is a unicorn; a pop of 10,000 is a paperweight.
This part of the model incorporates variables like:
- Performance Multiplier (F_perf): Rises with strong stats, falls with slumps.
- Scarcity Multiplier (F_scarcity): Higher when population is low.
- Demand Index (I_demand): Tracks trends by season, set, or player popularity.
- Macroeconomic Factor (I_market): Tied to economic indicators or a card market index.
The total value then becomes:
Estimated Value = Graded Value × F_perf × F_scarcity × I_demand × I_market
This allows for agile recalibration based on news cycles or market swings.
Pricing Strategy: When to Hold, When to Fold
If the model values a card at $500, do you list it at $600? $499? Start the auction at $1? Strategic pricing is a psychological and statistical game. A good strategy starts slightly above your model’s estimate, allowing room for offers. If there’s no traction, use Dutch auction-style drops — 5% per relisting cycle — until the item sells or hits a minimum ROI threshold.
Monitor engagement. If you see watchers but no bids, you’re close. No watchers? You’re off the mark. Update inputs (player news, comp sales) before every relist.
Fees: The Silent Killer of Profit
Platforms like eBay charge around 13% of the sale. Add $5–20 for shipping and insurance, and it’s clear why the gross sale price ≠ net profit. Always calculate net proceeds using:
Net = Sale Price × (1 — Fee Rate) — Shipping Cost
For a $200 sale, that could mean only $164 in your pocket. The model must account for all fees — platform, payment processor, shipping, insurance, and even grading costs — to avoid illusions of profitability.
ROI: The True Scorecard
Ultimately, you’re not collecting cardboard — you’re managing capital. ROI is the investor’s bottom line. The formula:
ROI = (Net Proceeds — Total Investment) / Total Investment × 100%
Say you paid $100 raw and $25 to grade. Total in = $125. Sold for $200. After fees and shipping, net = $164.
ROI = (164–125) / 125 = 31.2%
Want a 60% ROI? Solve for the needed sale price:
Sale Price = [(Investment × (1 + ROI Target)) + Shipping] / (1 — Fee Rate)
Plug in your numbers and let the model tell you if the dream is viable — or if you’re speculating blind.
Conclusion: A Smarter Way to Flip
This model doesn’t just help you price a card — it helps you understand it. It clarifies how grading adds value, how market forces push and pull that value, how auction strategy protects margins, and how ROI is your true North Star.
Use it before you list, relist, or invest. Input your costs, expectations, and grade assumptions. Let the math speak louder than the hype. Cardboard might be the asset, but intelligence is the true collectible.


